22% renewal shock. $1.2M on the table.
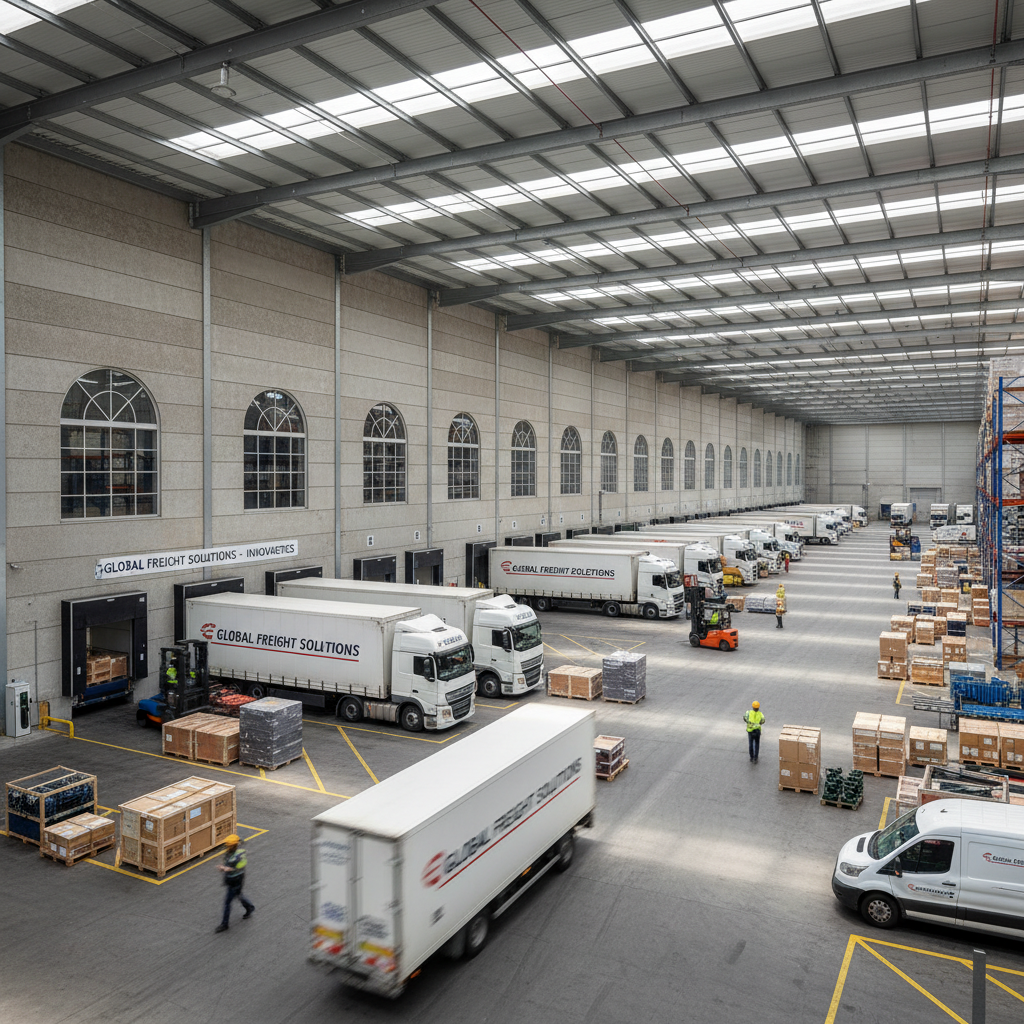
Hendricks Transport received their annual renewal from their fully-insured carrier in October 2024: a 22.4% increase, citing "adverse claims experience." At $15,200 per driver annually, the CFO was staring at $1.2M in new spend with no change in coverage. Meanwhile, HR was fielding 3–4 calls per week from drivers hitting out-of-network walls at rural urgent care centers.
30-day claims data audit — identified 3 high-cost claimant cohorts driving 68% of spend
Converted from fully-insured to level-funded with $125K stop-loss attachment
Renegotiated PBM contract — generic substitution rate lifted from 61% to 84%
Deployed network-gap analysis — added 14 in-network urgent care locations along primary routes
“We thought we were stuck with the increase. Catalyst came in, ran the numbers, and showed us exactly where the money was going. The stop-loss structure alone saved us more than we spent on the engagement.”
Union contract renewal. Benefits were the sticking point.
Piedmont Freight's upcoming Teamsters contract renewal had benefits at the center of negotiations. The current plan was fully-insured with a 19% year-over-year cost trajectory. Union reps were pushing for richer coverage; management was being told by their broker the only lever was cost-sharing increases. Both sides were stuck — until they audited the actual claims data.
Full 36-month claims analysis across all 12 terminals — identified terminal-level utilization variance
Designed self-funded plan with $400K aggregate stop-loss, terminal-level reporting
Implemented reference-based pricing for facility claims over $15K — 34% average reduction
Built cost-of-care transparency tool for drivers — mobile-first, Spanish/English
Structured savings-sharing model: 40% of savings reinvested into richer Rx coverage as union ask
“The union came in expecting a fight. When we showed them where the waste was and how the savings would fund better Rx coverage, the conversation completely shifted. Catalyst gave us a solution both sides could sign.”
Turnover at 180%. Benefits were the invisible cause.
SprintRoute's driver turnover had hit 180% annualized — a number leadership attributed to pay. An exit survey analysis told a different story: 61% of departing drivers cited benefits confusion or denial as a primary frustration. The company was spending $9,200 per eligible W-2 driver on a plan that drivers didn't understand, couldn't access, and didn't trust. The gig structure created compliance exposure. The broker had no logistics-specific experience.
Variable-hour ACA tracking system — automated 12-month lookback, eliminated compliance exposure
Redesigned plan into 3-tier structure: core (W-2 full-time), flex (variable-hour), gig-gap (1099 voluntary)
Deployed driver benefits concierge — SMS-based, 24/7, bilingual (English/Spanish)
Reduced plan complexity from 14 line items to 4 — enrollment rate jumped from 34% to 71%
Renegotiated stop-loss with variable-headcount rider — premium adjusts monthly with headcount
“We were treating benefits like a cost center we couldn't control. Catalyst showed us it was a retention lever we'd been ignoring. The SMS concierge alone changed how drivers felt about the company.”
From renewal shock to restructured plan in 90 days.
Three phases. Every step anchored to your data. No boilerplate — your plan is rebuilt around your fleet's actual claims, routes, and driver demographics.
We read your data before we touch your plan.
Full 24–36 month claims analysis. We identify the 3–5 claimant cohorts driving 60–70% of your spend. No assumptions — every recommendation is anchored to your actual utilization data.
We rebuild the plan around your drivers' actual care patterns.
Level-funded or self-funded transition design, stop-loss structuring, PBM renegotiation, and network optimization. Every change is modeled against your claims data before implementation.
We manage the transition so your HR team doesn't have to.
Carrier negotiation, enrollment communication, driver education materials, and compliance documentation. We stay accountable to the savings number we projected.
47 fleets restructured. 47 savings stories.
“We'd been with the same carrier for six years. Catalyst showed us we'd been overpaying by $3,100 per driver the entire time. That's a number that's hard to unsee.”
“Our HR team was spending 40% of their time on benefits escalations. After the restructure, that dropped to under 10%. The ROI isn't just in the premium savings.”

“The stop-loss structure they designed has paid for itself three times over in two years. One catastrophic claim that would have blown our budget got capped at the attachment point.”
“Driver complaints about out-of-network denials dropped 78% in the first quarter. That's not a benefits story — that's a retention story.”

“Our broker had been telling us self-funding was too risky for a fleet our size. Catalyst showed us exactly how to structure the stop-loss to make it safer than what we had.”
“The benchmark report alone was worth it — we realized we were 34% above market before we even got on a call. By the time the audit was done, we had a clear path to parity.”

“We'd been with the same carrier for six years. Catalyst showed us we'd been overpaying by $3,100 per driver the entire time. That's a number that's hard to unsee.”
“Our HR team was spending 40% of their time on benefits escalations. After the restructure, that dropped to under 10%. The ROI isn't just in the premium savings.”
“The stop-loss structure they designed has paid for itself three times over in two years. One catastrophic claim that would have blown our budget got capped at the attachment point.”
“Driver complaints about out-of-network denials dropped 78% in the first quarter. That's not a benefits story — that's a retention story.”
“Our broker had been telling us self-funding was too risky for a fleet our size. Catalyst showed us exactly how to structure the stop-loss to make it safer than what we had.”
“The benchmark report alone was worth it — we realized we were 34% above market before we even got on a call. By the time the audit was done, we had a clear path to parity.”
“The benchmark report alone was worth it — we realized we were 34% above market before we even got on a call. By the time the audit was done, we had a clear path to parity.”
“Our broker had been telling us self-funding was too risky for a fleet our size. Catalyst showed us exactly how to structure the stop-loss to make it safer than what we had.”
“Driver complaints about out-of-network denials dropped 78% in the first quarter. That's not a benefits story — that's a retention story.”
“The stop-loss structure they designed has paid for itself three times over in two years. One catastrophic claim that would have blown our budget got capped at the attachment point.”
“Our HR team was spending 40% of their time on benefits escalations. After the restructure, that dropped to under 10%. The ROI isn't just in the premium savings.”
“We'd been with the same carrier for six years. Catalyst showed us we'd been overpaying by $3,100 per driver the entire time. That's a number that's hard to unsee.”
Start with the data.
The savings follow.
Get Your Benefits Audit
We analyze your current plan, identify waste, and deliver a savings projection in 30 days. No cost, no commitment.
See where your fleet stands.
Compare your current per-driver cost against the 2026 benchmarks for your fleet size and region. Most fleets discover they're 20–40% above market before they even speak to us.